State of Power 2012 Exposing the Davos Class
Who are the global 1%? What companies do they run? How do they escape accountability? Check out TNI's powerful infographic displays that expose the social and environmental costs of global corporate power.
Download PDF
The economic, social and ecological crises humanity face are no accident, but a result of policies pursued by a small corporate elite - best known as the Davos class - that has systematically hijacked political and economic policy throughout the world.
TNI, as part of its new Corporate Power project, is producing a series of infographics over 2012 that expose the reality of corporate power, and our need to fundamentally change direction. Please download and share these infographics, and watch out for new ones over the coming months.


| Introduction to the Davos Class Susan George The Davos class run our major institutions and know exactly what they want, but they face a huge crisis of legitimacy because their ideology isn't working and they have virtually no ideas nor imagination to resolve this. |
|
|
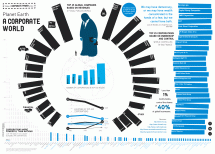
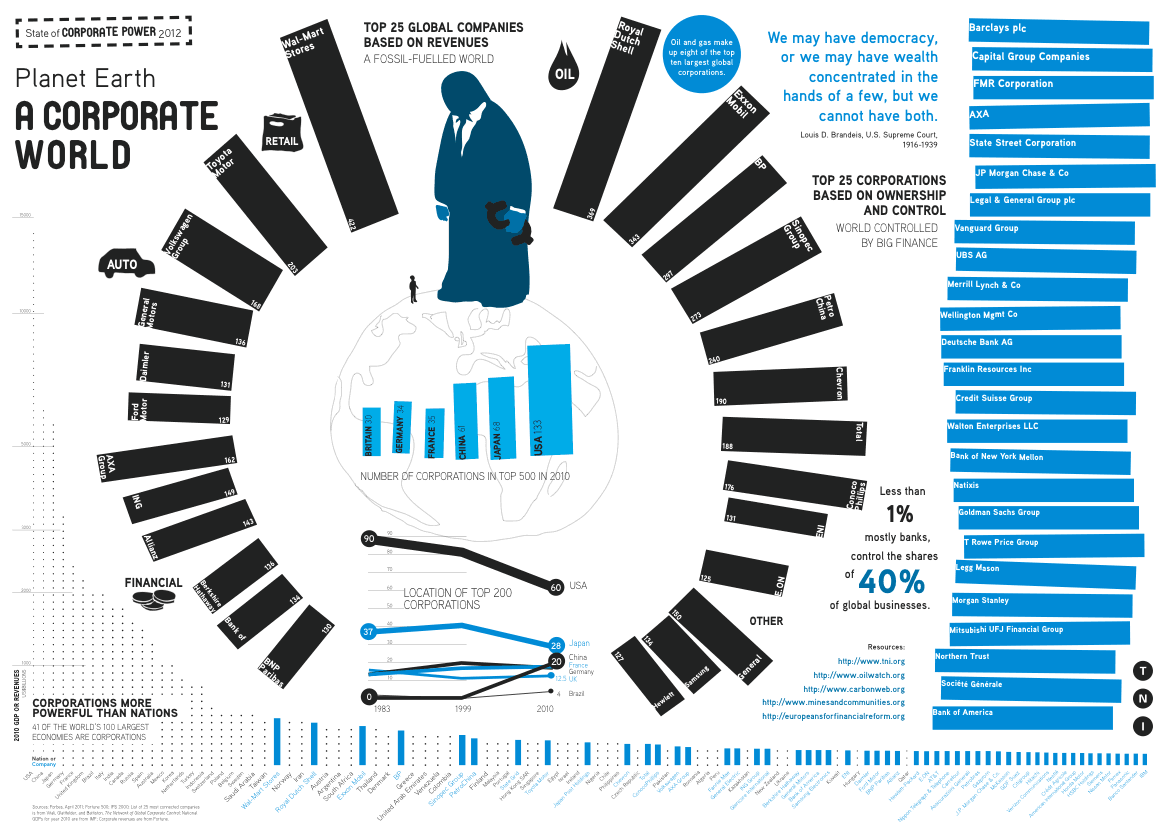
Planet Earth: A Corporate Run World Which are the biggest companies in the world? Which corporations control them? How does their power compare with states? |
|
|
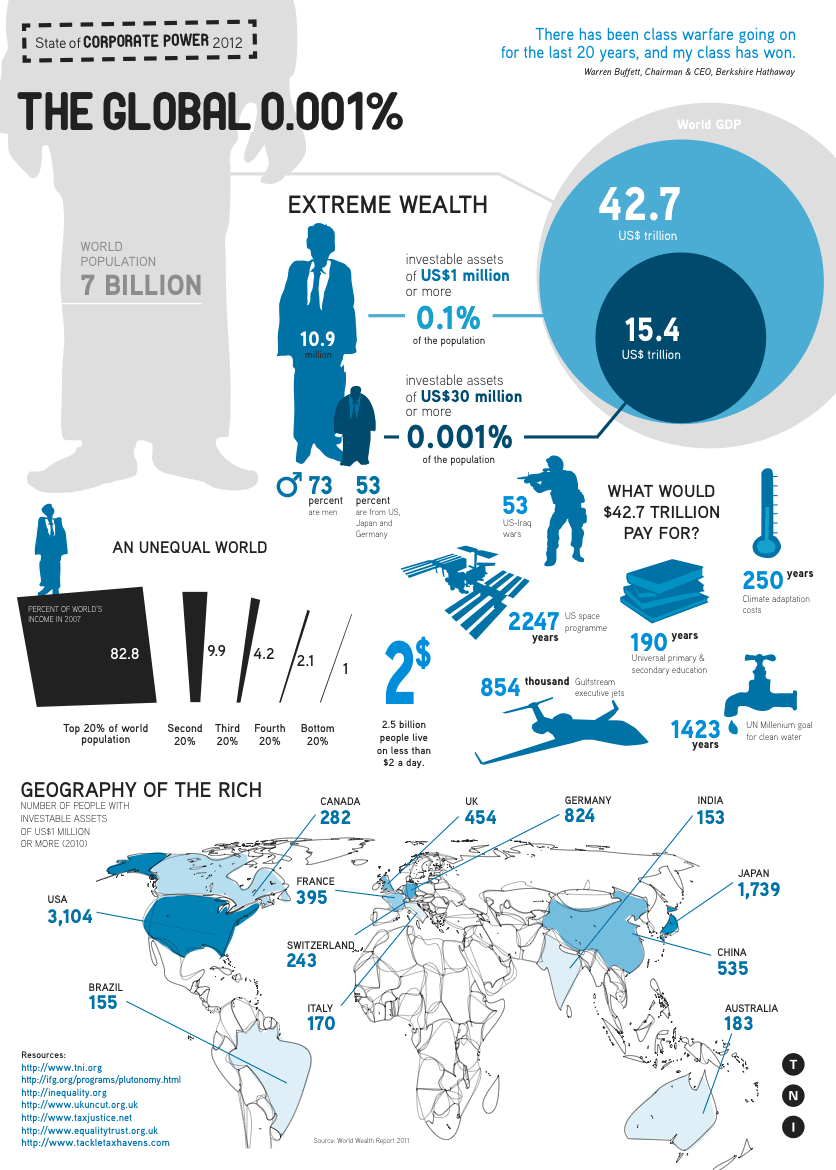
The Global 0.001% Just 10.9 million people, or 0.15%, control $42.7 trillion dollars or two thirds of world GDP. An even tinier group of people, 0.001%, control a third of that amount. Where are they based? What could this money pay for? |
|
|
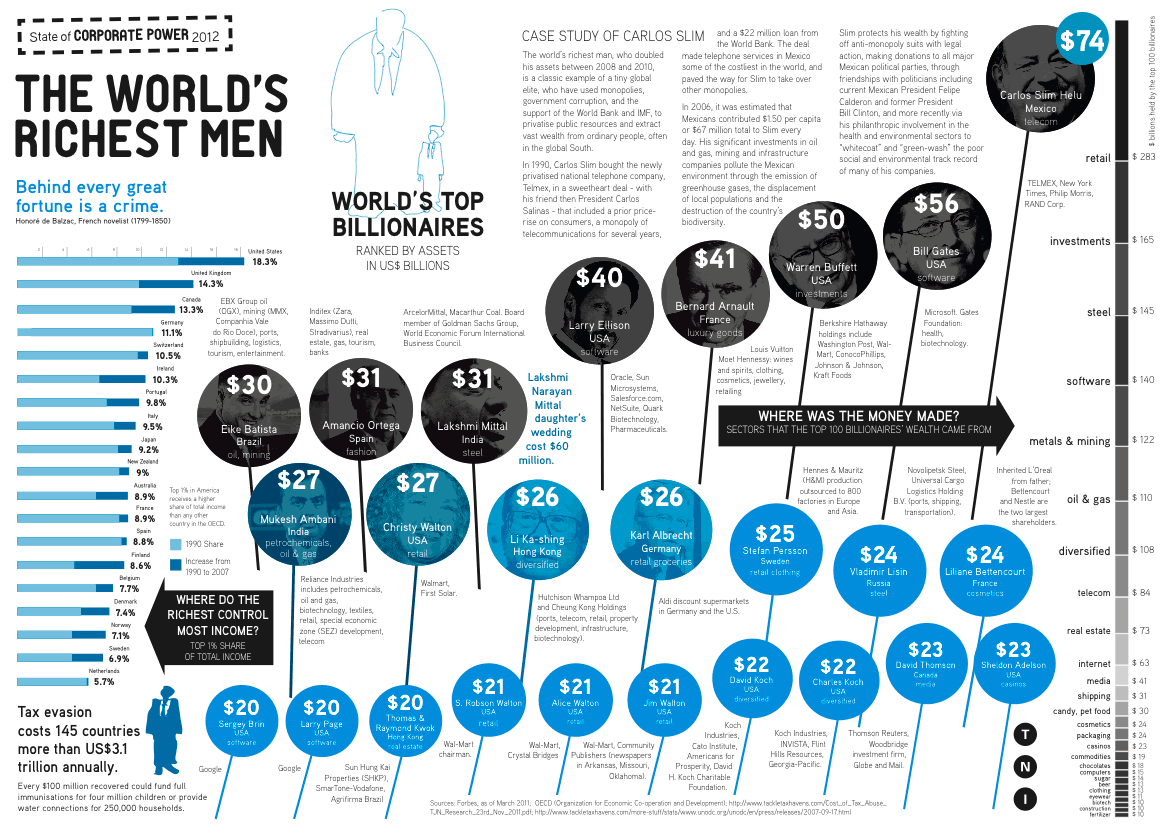
The World's Richest Men Who are they and how did they make their money? Which are the best countries to be rich in? (Version revised: 25 Jan 2012) |
|
|
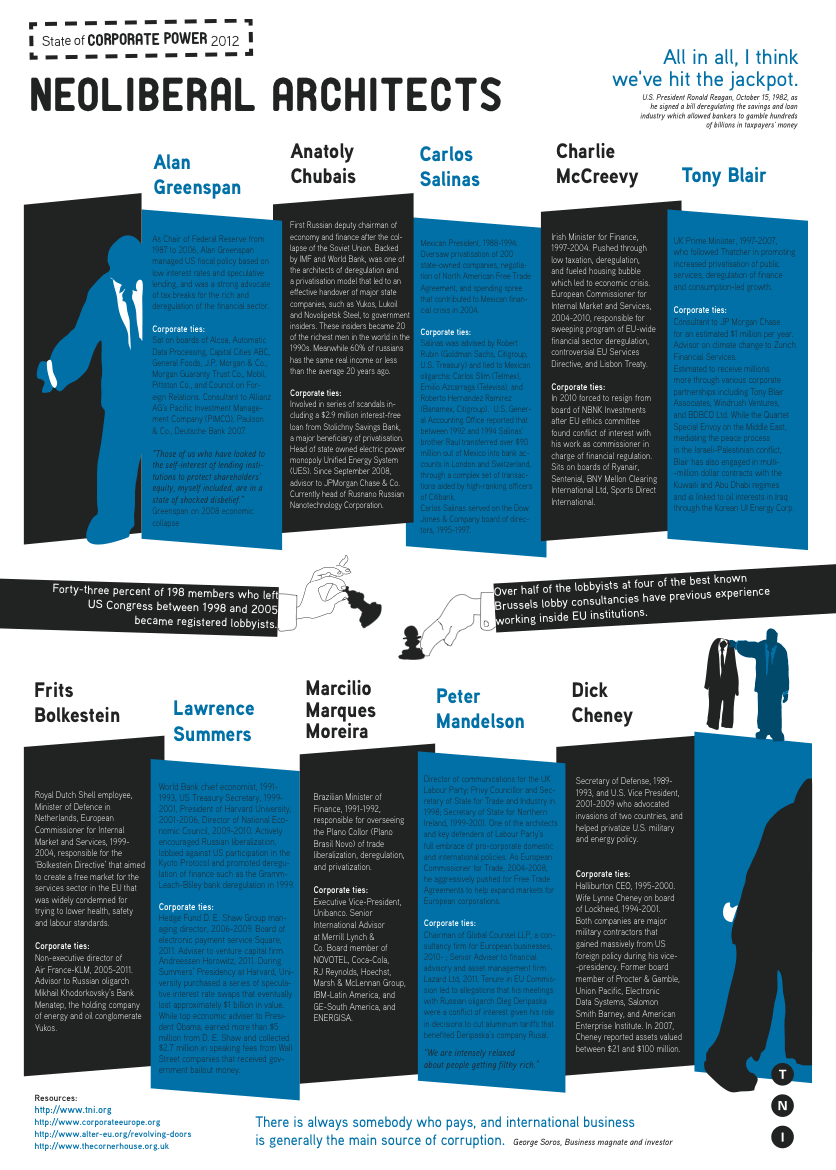
Neoliberal architects A global economy that has benefited a small elite is no accident: it was carefully designed by politicians who often worked for transnational corporations and at times were rewarded by them after leaving office. |
Sources
Planet Earth: A Corporate World
Top 25 companies based on revenues: Forbes, April 2011
Top 25 companies based on ownership and control: Vitali, Glattfelder, and Battiston, The Network of Global Corporate Control, 2011
Corporations more powerful than nations: Nations' GDP from IMF website; company revenue from Fortune 500
Location of Top 200 corporations and number of Top 500 corporations per country: Fortune 500
The global 0.001%
Extreme wealth and Geography of the Rich: Capgemini and Merrill Lynch Global Wealth Management, World Wealth Report 2011
An unequal world: Isabel Ortiz and Matthew Cummins, Global inequality: Beyond the Bottom Billion , UNICEF April 2011 f
What would $42.7 billion pay for?
- US-Iraq War: direct costs so far have been $800 billion but indirect costs could top $4 trillion, MarketWatch, December 2011
- US space programme: US White House website
- Gulfstream Executive Jet: Business & Commercial Aviation's
- 2010 Purchase Planning Handbook
- Universal primary and secondary education: Calculated from http://www.amacad.org/publications/cohen_intro.pdf, p.3,22
- Meeting UN Millennium Development Goal on Clean Water: UNESCO website
- Climate change adaptation: UNFCCC (2008). Investment and Financial Flows to Address Climate Change. UNFCCC, Bonn
World's top billionaires and sectors the wealth came from: Forbes.com, March 2011
Case study of Carlos Slim: Outing the oligarchy - billionaires who benefit from today’s climate crisis, International Forum on Globalization (IFG)
Tax rates in different OECD countries: Center of Budget and Policy Priorities http://www.cbpp.org/
Tax evasion costs: Tax Justice Network, Cost of Tax Abuse, November 2011
Neoliberal architects
Alan Greenspan:
- Testimony before the U.S. House Committee on Oversight and Government Reform, October 23, 2008.
- Reuters, September 22, 2008; Marketwatch, September 26, 2008.
Anatoly Chubais
- Ken I. Kim and Anna Yelkina, Privatization in Russia: Its Past, Present, and Future, SAM Advanced Management Journal, Winter 2003. See also Thane Gustafson, Capitalism Russian-style, chapter 8; Anne Williamson, Contagion: The Betrayal of Liberty; http://www.lenta.ru/lib/14160313/full.htm; and ttp://russiaprofile.org/bg_people/resources_whoiswho_alphabet_c_chubais.html
- Thane Gustafson, Capitalism Russian-style, chapter 3; and Janine R. Wedel, The Harvard Boys Do Russia, The Nation, June 1, 1998.
- Reuters, September 22, 2008; and Aaron Mulvihill, Russia Today
- Marketwatch, September 26, 2008.
Marcilio Marques Moreira
Carlos Salinas
- Jeff Faux, The Global Class War: How America's Bipartisan Elite Lost Our Future.
- U.S. GAO, Private Banking: Raul Salinas, Citibank, and Alleged Money Laundering, GAO/OSI-99-1
- http://www.pbs.org/wgbh/pages/frontline/shows/mexico/family/citibankaffair.html.
- http://www.cidob.org/es/documentacion/biografias_lideres_politicos/america_del_norte/mexico/carlos_salinas_de_gortari#6
Charlie McCreevy
- The Independent, January 19, 2009
- http://www.europeanvoice.com/article/2010/10/mccreevy-quits-bank-post-after-ethics-ruling/69135.aspx
- http://www.ryanair.com/en/investor/board-of-directors
Dick Cheney
- http://www.nationalcorruptionindex.org/pages/profile.php?profile_id=230
- http://www.tampabay.com/news/humaninterest/article997996.ece
- http://www.reuters.com/article/2007/05/15/us-bush-wealth-idUSN1545236120070515
Frits Bolkestein
- http://www.volkskrant.nl/vk/nl/2680/Economie/article/detail/685200/2005/05/24/Bolkestein-adviseur-van-moedermaatschappij-Yukos.dhtml
- http://managementscope.nl/magazine/artikel/252-Chordovski-Poetin-Yukos
Lawrence Summers
- Financial Industry Paid Millions to Obama Aide, New York Times, April 3, 2009.
- Bloomberg News, March 3 and December 18, 2009.
Peter Mandelson
- The Moscow Times, Oct 22, 2008
- The Times, Oct 13, 2008
- The Guardian, Oct 21, 2008
- The Telegraph, Oct 24, 2008, http://www.telegraph.co.uk/news/politics/georgeosborne/3253562/Lord-Man…
Tony Blair
- BBC News, January 10, 2008.
- The Guardian http://www.guardian.co.uk/politics/series/blair-mystery and articles by David Leigh and Ian Griffiths on Dec 1, 2009, http://www.guardian.co.uk/politics/2009/dec/01/mystery-tony-blair-finances and Dec 19, 2009, http://www.guardian.co.uk/politics/2009/dec/17/mystery-tony-blairs-money-solved
- Dispatches: The Wonderful World of Tony Blair, http://www.youtube.com/watch?v=Tg-Dc3nmdYA
- The Guardian, March 17, 2010.
Research: George Draffan
Design: Ricardo Santos