Does China pose a challenge to the US empire? Infographics: State of Power 2025
China has some significant economic strengths.

Source: Michael Roberts, 2024. https://thenextrecession.wordpress.com/wp-content/uploads/2024/03/picture10-1.png
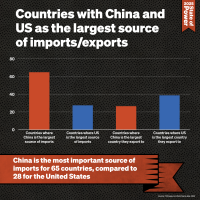
It has become the world’s manufacturing super-power.

Source: Richard Baldwin based on OECD data, 2024. https://cepr.org/sites/default/files/styles/flexible_wysiwyg/public/2024-01/baldwin17janfig2_0.png?itok=zGASago_
And has financial companies now that are bigger than those in the US.

Source: TNI based on Fortune Global 500, 2024.
China is also making itself less dependent on exports and developing its internal market.

Source: Richard Baldwin based on OECD data, 2023. https://shorturl.at/Crbae
China is investing significantly in key new emerging economic sectors.

Source: European Patent Office Data Desk, 2024. https://www.epo.org/en/about-us/observatory-patents-and-technology/data-desk

ource: TNI based on IEA World Energy Investment, 2024. https://www.iea.org/data-and-statistics/data-product/world-energy-investment-2024-datafile
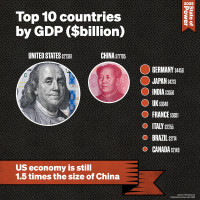
But it still has some way to go to pose a serious political, economic or military challenge to the US

Source: TNI based on SIPRI, 2024. https://milex.sipri.org/sipri
Its corporations in most sectors are still trailing the US when it comes to profits.

Source: S. K. Starrs' calculations from Forbes Global 2000, 2024 (with research assistance from Quoc Linh Pham & Yizhou Miao)
US also continues to lead the world in terms of Big Tech.

Source: TNI based on Companies Market Cap, November 2024. https://companiesmarketcap.com
The research for these infographics was done by Benjamin Wray with the support of Nick Buxton. Sean Kenji Starrs also provided graphics based on his own calculations. The designs were done by Evan Clayburg.
These infographics are part of the State of Power 2025 report: Geopolitics of Capitalism. You can access the full report here.
Other infographics
State of power 2025These infographics are part of the State of Power 2025 report: Geopolitics of Capitalism. You can access the full report here.
-
Which country rules the world? Infographics: State of Power 2025
-
In an age of great power rivalry where does that leave the rest of the world? Infographics: State of Power 2025