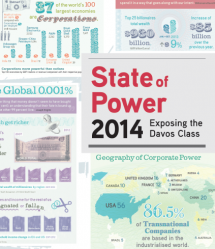
State of Power 2014
In its third annual ‘State of Power’ report, TNI uses vibrant infographics and penetrating essays to expose and analyse the principal power-brokers that have caused financial, economic, social and ecological crises worldwide.

Contents
Introduction
Nick Buxton
State of Corporations – The rise of illegitimate power and the threat to democracy (PDF, 902KB)
Susan George
State of Davos – The camel’s nose in the tents of global governance (PDF, 308KB)
David Sogge
State of Surveillance –The NSA files and the global fightback (PDF, 778KB)
Ben Hayes
State of Empire - How failed foreign policy, new emerging economies, and peoples’ movements are undermining US power (PDF, 526KB)
Phyllis Bennis
State of the South – Emerging powers and the potential for progressive change (PDF, 760KB)
Achin Vanaik
State of the State – The state is dead! Long live the state! (pdf, 728KB)
Daniel Chavez
State of our Planet – Fateful triangle of big energy, finance and complicit governments (PDF, 537KB)
Steve Horn and Peter Rugh, Occupy.com
State of Europe - How the European Round Table of Industrialists came to wage class war on Europe (PDF, 332KB)
Andrew Gavin Marshall, Occupy.com
State of Extraction – The new scramble for Africa (PDF, 460KB)
David Fig
State of the Land - Reconfiguration of the power of the state and capital in the global land rush (PDF, 348KB)
Saturnino M. Borras Jr.
State of Counter Power - How understanding neoliberalism’s cultural underpinnings can equip movements to overthrow it (PDF, 377KB)
Hilary Wainwright
Report infographics


|
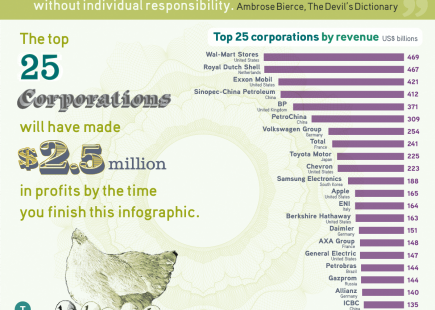
Planet Earth: A Corporate World Which are the biggest companies in the world? Which corporations control them? How does their power compare with states? |
|
|
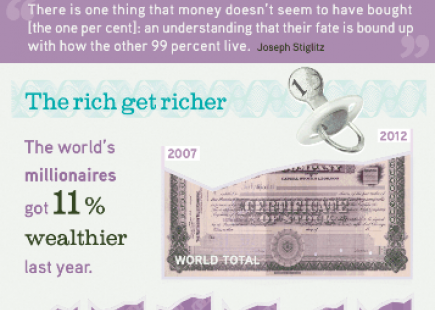
The rich are getting richer - Only 100 people (that is 0,00001% of the global population) control 2 trillion dollars. What remains for the rest of us? And what could their wealth pay for? |
|
|
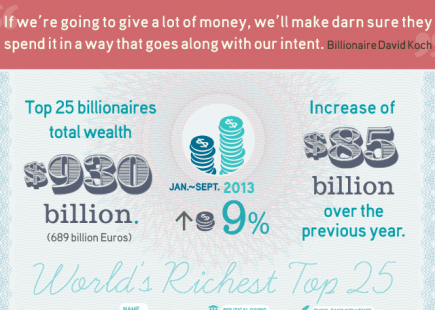
The super-rich aren't just wealthy; many are also actively involved in shaping public policy. An overview of the political impact of the world's 25 richest people. |
|
Sources used in Infographics
CORPORATE PLANET
Corporations Ranked by Revenues and Assets data are from Forbes Global 2000 Leading Companies and Relbanks Top 50 Banks In The World.
Crimes, Fines, and Abuses includes significant fines, court cases and substantiated allegations made or in process in the last five years; data and sources here
Location of Top 200 TNCs By Country is based on Forbes Global 2000 Leading Companies.
Corporations More Powerful Than Nations: corporate revenue and employment data are from Forbes Global 2000 Leading Companies; national GDP data are from International Monetary Fund, World Economic Outlook Database, April 2013; national population data are from CIA World Factbook, July 2013.
GLOBAL 001%
Joseph Stiglitz quote is from Of the 1%, by the 1%, for the 1%, Vanity Fair, May 2011.
Change in Total Wealth of HNWI By Region data are from Capgemeni and RBC Wealth Management, 2013 World Wealth Report.
Median Household Income data are from Eurostats, Mean and Median Income by Household Type and
U.S. Census Bureau, Historical Income Tables: Households, Table H-8, Household Income by State.
What the Top 100 People’s Wealth Could Pay For data is calculated from Mint.com, TNI, CIA World Factbook, and CollegeBoard.
Winners and Losers in the Economic Crisis data are from OECD, 2013, Crisis Squeezes Income and Puts Pressure on Inequality and Poverty.
Slices of Inequality data are from CIA World Factbook, Household Income or Consumption by Percentage Share.
WORLD’S RICHEST MEN
Billionares’ wealth data are from Bloomberg Billionaires as of September 13, 2013.
Billionares’ political influence information is from sources cited here
Concentration of Income and Campaign Contributions data are from Bonica et al, Why Hasn’t Democracy Slowed Rising Inequality?, Journal of Economic Perspectives, 27(3), Summer 2013.
Philanthropy Is No Substitute for Taxation data are from Bloomberg Billionaires as of September 13, 2013; Forbes, World’s Biggest Givers; and Chronicle of Philanthropy, Facts & Figures: America's Top Donors.
Coordinator and Editor: Nick Buxton
Research: George Draffan
Design: Ricardo Santos, Barbara Castro Urío, and Cathy Hull
Pages: 100