In an age of great power rivalry where does that leave the rest of the world? Infographics: State of Power 2025
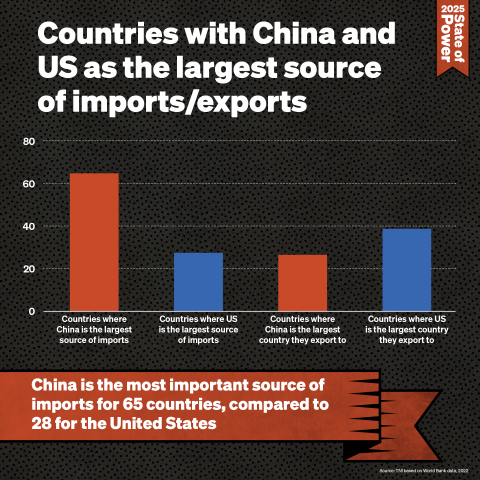
China has become the major trade partner for more and more countries giving countries more trade and investment options
Source: TNI based on World Bank data, 2022. https://wits.worldbank.org/Default.aspx?lang=en
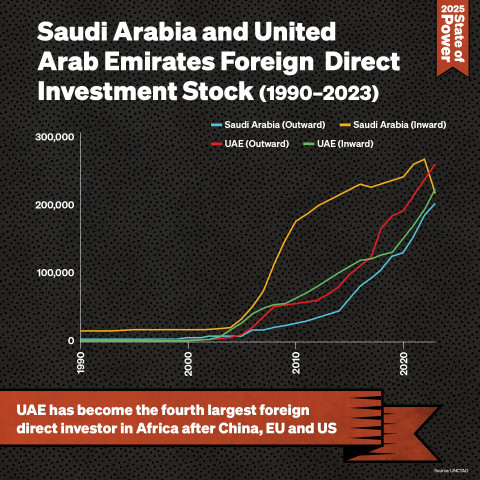
Although much smaller than China and the US, middle Powers, especially oil-producing countries, are becoming more significant global players.
Source: TNI based on UNCTAD database, 2024. https://unctadstat.unctad.org/datacentre/
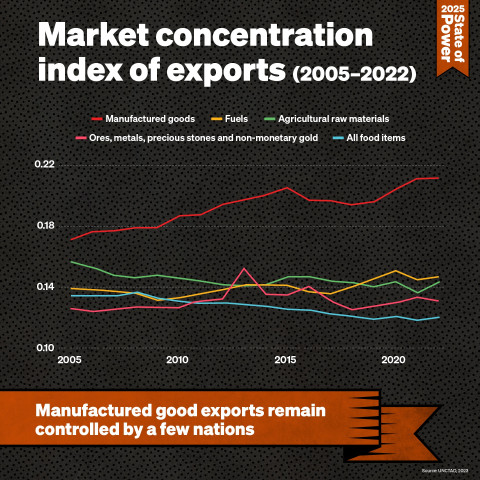
But developing countries still mainly have access to primary commodity export markets.
Source: UNCTAD database, 2023. https://unctadstat.unctad.org/insights/theme/12#metadata
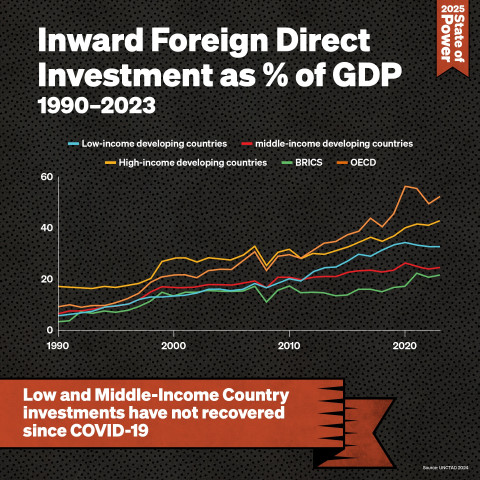
Overall foreign direct investment in low and middle-income countries has also fallen since 2020.
Source: UNCTAD database, 2024. https://unctadstat.unctad.org/datacentre/
With growing protectionism hitting world trade/globalisation even before Trump took office
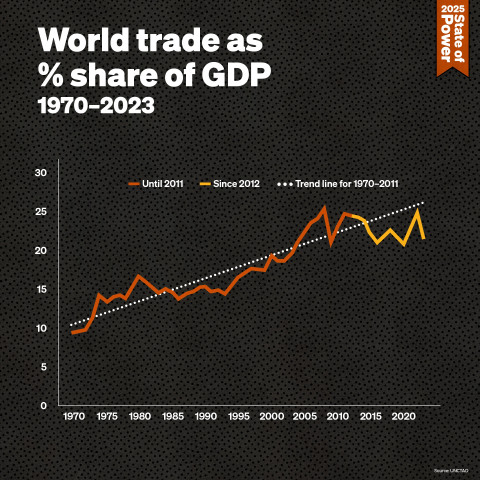
Source: UNCTAD, 2024. https://unctad.org/news/reshaping-global-trade-how-developing-countries-can-strategize
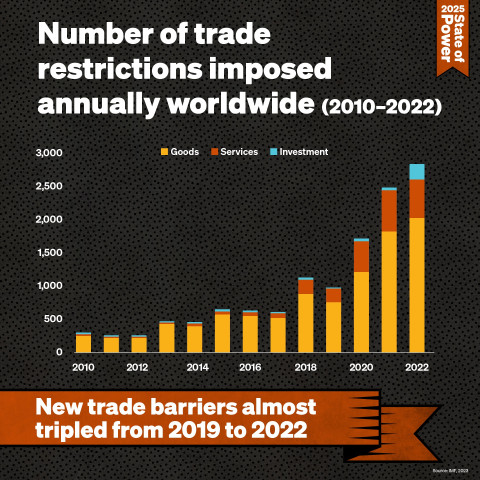
Source: IMF, 2023. https://www.imf.org/en/Blogs/Articles/2023/08/28/the-high-cost-of-global-economic-fragmentation
Countries across Africa have failed to recover from the global economic crisis and pandemic.
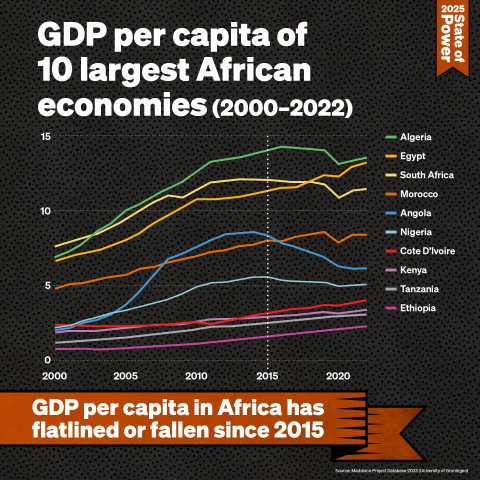
Source: TNI based on Maddison Project Database, 2023. https://dataverse.nl/dataset.xhtml?persistentId=doi:10.34894/INZBF2
Indebtedness in low and middle income countries is becoming an increasingly major block to development.
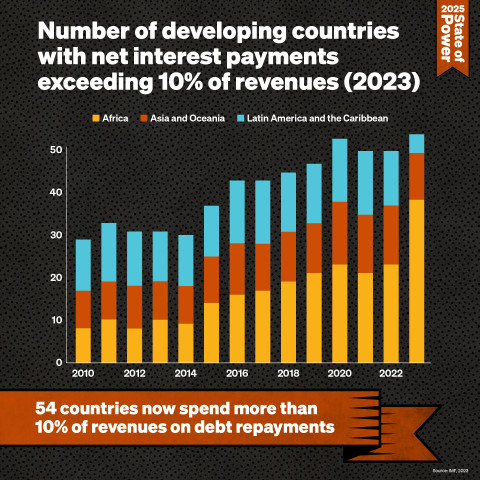
Source: UN GCRG based on IMF World Economic Outlook, 2024. https://unctad.org/publication/world-of-debt
The research for these infographics was done by Benjamin Wray with the support of Nick Buxton. Sean Kenji Starrs also provided graphics based on his own calculations. The designs were done by Evan Clayburg.
Other infographics
State of power 2025These infographics are part of the State of Power 2025 report: Geopolitics of Capitalism. You can access the full report here.